Edit chart
Loading graph
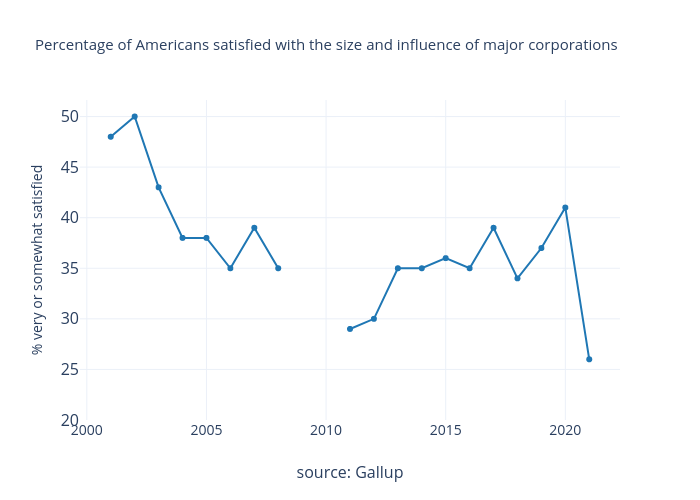
Michelezanini's interactive graph and data of "Percentage of Americans satisfied with the size and influence of major corporations" is a , showing trace 0; with source: Gallup in the x-axis and % very or somewhat satisfied in the y-axis.. The x-axis shows values from 1999.743683568566 to 2022.256316431434. The y-axis shows values from 20 to 51.63309352517986.